Statistics and Probability
Year 2 Curriculum Requirements:
1. Identify a question of interest based on one categorical variable. Gather data relevant to the question (determining the variety of birdlife in the playground and using a prepared table to record observations) ACMSP048
2. Collect, check and classify data (recognising the usefulness of tally marks & identifying categories of data and using them to sort data) ACMSP049
3. Create displays of data using lists, table and picture graphs and interpret them (creating picture graphs to represent data using one-to-one correspondence & comparing the usefulness of different data displays) ACMSP050Year 2 Curriculum:
Year 2 Achievement Standards:
1. Students collect, organise and represent data to make simple inferences.
2. Students make sense of collected information.
Questions? Questions?

Overview:
Model the posing of simple questions. For example, after lunch, ask: Do you think most of us had sandwiches for lunch? What type of fruit do most people like? How many different sorts of biscuits do we eat? Next, ask: how could we find out if most of us had sandwiches for lunch? Do you think that is the same for the class next door? How could we find out? Draw out that these are questions that could be answered by collecting information. Ask students to volunteer some more questions. Discuss with the class whether they can be answered by collecting information. Revise the questions if necessary. Ask students to make up a question of their own that their partner could answer by collecting information.
Model the posing of simple questions. For example, after lunch, ask: Do you think most of us had sandwiches for lunch? What type of fruit do most people like? How many different sorts of biscuits do we eat? Next, ask: how could we find out if most of us had sandwiches for lunch? Do you think that is the same for the class next door? How could we find out? Draw out that these are questions that could be answered by collecting information. Ask students to volunteer some more questions. Discuss with the class whether they can be answered by collecting information. Revise the questions if necessary. Ask students to make up a question of their own that their partner could answer by collecting information.
Firing up the Brain:
Five Steps to 50!
Materials: Whiteboards/scrap paper, whiteboard marker, partner.
Task:
1. Roll a dice twice (photo below) to establish your starting number - the first roll will give you the tens digit and the second roll will give you the units digit.
2. You can then make five jumps to get as close to 50 as possible.
3. You can jump forwards or backwards in jumps of 1 or 10 or 100.

|
|
Preparing the Brain:
WALT: Pose simple questions to collect data on.
WILF: Write a simple question that can be used to collect data.
Social Goal: Be cooperative and collaborative.
WILF: Write a simple question that can be used to collect data.
Social Goal: Be cooperative and collaborative.
Engaging the Brain:
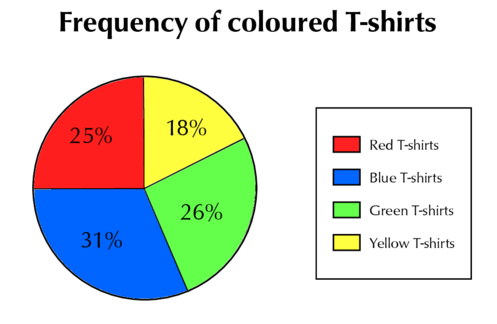
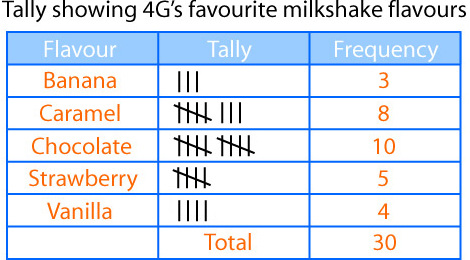
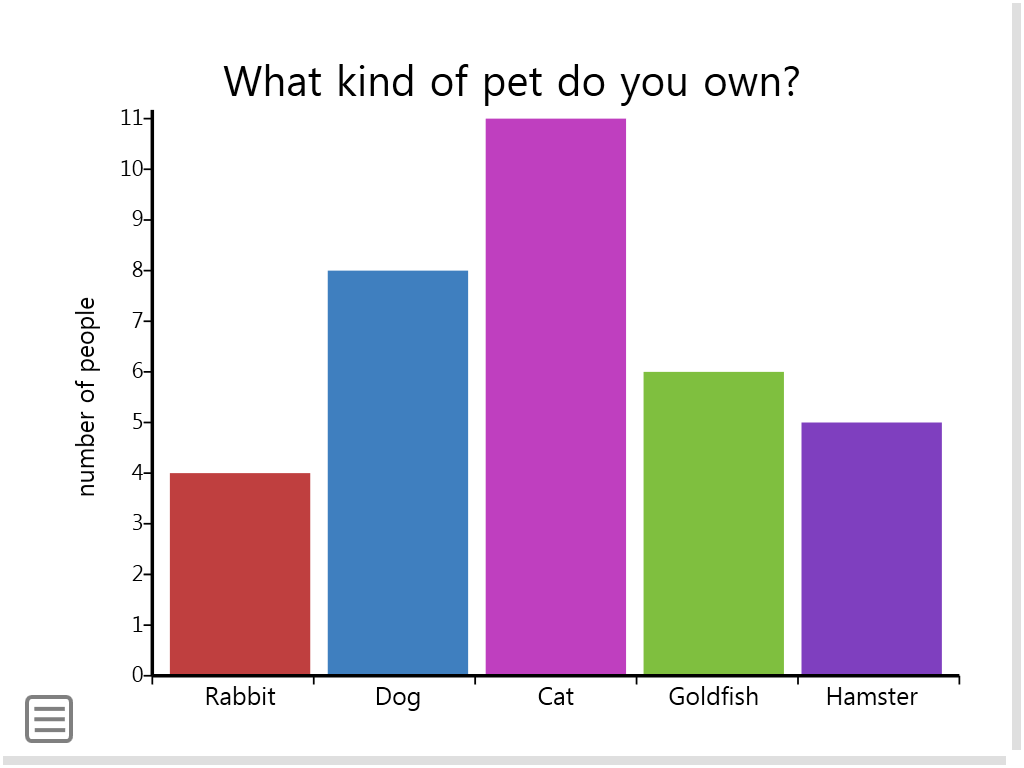
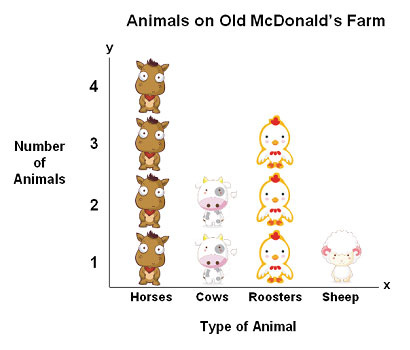
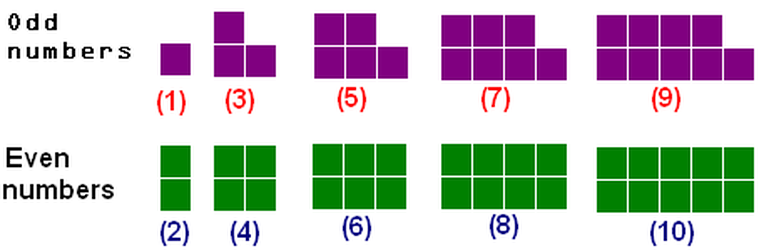
1. Look and discuss these graphs.
2. What question do you think the data collector asked to be able to create these graphs?
2. What question do you think the data collector asked to be able to create these graphs?
|
|
|
|
|
|
Questions to Consider:
Do you think most of us had sandwiches for lunch?
What type of fruit do most people like?
How many different sorts of biscuits do we eat?
How could we find out if most of us had sandwiches for lunch?
Do you think that is the same for the class next door?
How could we find out?
Do you think most of us had sandwiches for lunch?
What type of fruit do most people like?
How many different sorts of biscuits do we eat?
How could we find out if most of us had sandwiches for lunch?
Do you think that is the same for the class next door?
How could we find out?
Stretching the Brain:
1. Write your own simple question to collect data on.
2. Ask your question to ten participants (inside outside circle)
3. Record your data.
2. Ask your question to ten participants (inside outside circle)
3. Record your data.
Strengthening the Brain:
Which of these is a better question to ask? Why
a) What is your favourite sport?
b) Which of the following do you enjoy the most?
- Netball
- Soccer
- Basketball
- Cricket
- Football
- Swimming
- Tennis
a) What is your favourite sport?
b) Which of the following do you enjoy the most?
- Netball
- Soccer
- Basketball
- Cricket
- Football
- Swimming
- Tennis
Searching Questions
Lesson Summary: Model the process of extending simple questions into more searching questions. For example: ‘Are the boys or girls in our class taller?’ could be extended to ‘What if we were in a Year 6 class? What if we were talking about Year 12 girls and boys? What if we were asking about adults? Does age make a difference?’

Firing up the Brain:
Investigate number sequences, initially those increasing and decreasing by twos, threes, fives and tens from any starting point, then moving to other sequences (ACMNA026)

|

|

|
Preparing the Brain:
WALT: Understand the difference between a simple question and a searching question.
WILF: You can create your own searching question.
Social Goal: Look for solutions
WILF: You can create your own searching question.
Social Goal: Look for solutions
Engaging the Brain:
Who is taller? Girls or Boys?

Who is taller? Year 5 Girls or Year 5 Boys?

Who is taller? Year 12 Girls or Boys?

Which of the questions would be the easiest to answer?
Which of the questions would the answer be the most consistent?
A searching question allows us to to then think of further questions to give us more specific results.
Which of the questions would the answer be the most consistent?
A searching question allows us to to then think of further questions to give us more specific results.
Stretching the Brain:
Create a searching question (general question) and then create 2 more related questions.
Some ideas:
- Sports
- Height
- Shoe size
Some ideas:
- Sports
- Height
- Shoe size
Strengthening the Brain:


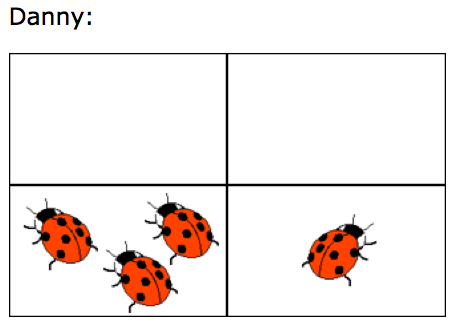
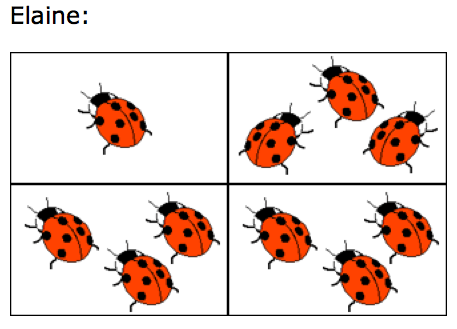
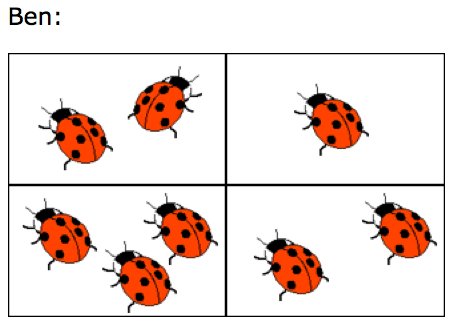
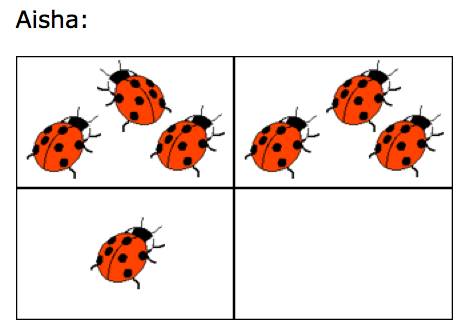
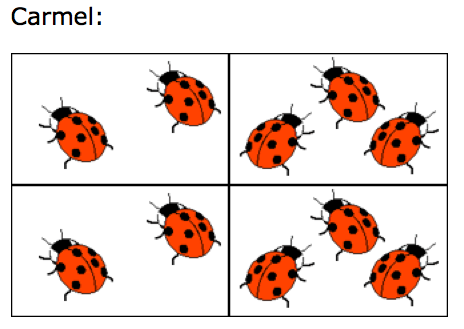
Ladybird Count
Summary:
First, the children need to begin to make sense of the situation. It is probably helpful to ask them to think about the pictures and to talk to each other about what the problem means. Offer them plenty of opportunities to think, without insisting on quick answers. After they have had this chance, find out their ideas and, if need be, they can be encouraged to focus by asking them how many ladybirds each child has.
From this point the question concentrates on how the data could be represented. Be prepared to consider a variety of responses: the solutions do not need to be bar charts or pictograms. Their suggestions will provide insight into the children's own methods of recording. Engaging in conversation with them about their representation may be essential and this is a great way to probe their previous experiences of handling and recording data.
The resulting representations would make a meaningful display.

|

|

|
Firing up the Brain:
Recognise, model, represent and order numbers to at least 1000 (ACMNA027)
Preparing the Brain:
WALT: Create displays of data using lists, table and picture graphs and interpret them.
WILF: Create displays that are neat, accurate and correctly labelled.
Social Goal: Follow instructions.
WILF: Create displays that are neat, accurate and correctly labelled.
Social Goal: Follow instructions.
Engaging the Brain:
Stretching the Brain:
|
|
|
|

Graph:
1 - graph the number of lady birds each person has
2 - graph the frequency of 1 ladybug cards, 2 ladybug cards etc.
Extension:
a) What is a fact you can tell me about each graph?
b) How are the graphs different?
c) How are the graphs different?
Reasoning/Problem Solving:
Consider the following questions, can you answer them based on your data? How do you know?
- Did boys have more ladybugs than girls?
- How many "4 ladybug" cards were drawn out?
- Who won the game?
Strengthening the Brain:
Out at Play
Note: You will need to use an empty classroom to complete this activity!
Task Summary: Ask students how they could decide how many children there are in another class when their classroom is empty. For example, they could count chairs, desks, bags, hats or lunch orders. Ask: How can we be sure that what we have counted will tell us how many students in that class are at school today?
Firing up the Brain:
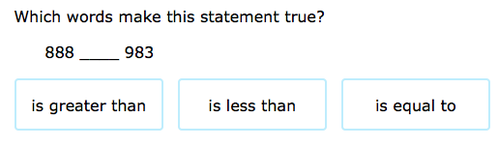
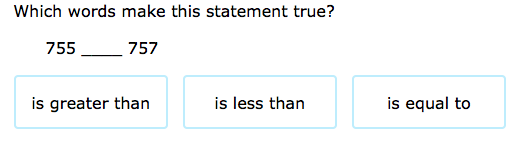
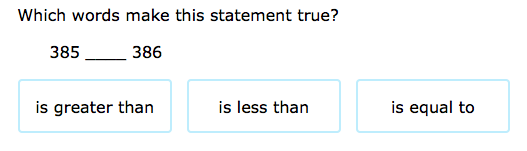
Can you arrange these digits in the five boxes below to make two-digit numbers as close to the targets as possible? You may use each digit once only.
Preparing the Brain:
WALT: Develop strategies to collect data
WILT: You collect data that is displayed accurately, neatly and can explain your reasons.
Social Goal: We respect our school at all times.
WILT: You collect data that is displayed accurately, neatly and can explain your reasons.
Social Goal: We respect our school at all times.
Engaging the Brain:
What can you expect to see when you walk into a classroom?
If you didn't know how many students were at school on that day, is there a way you could figure it out?
If you didn't know how many students were at school on that day, is there a way you could figure it out?
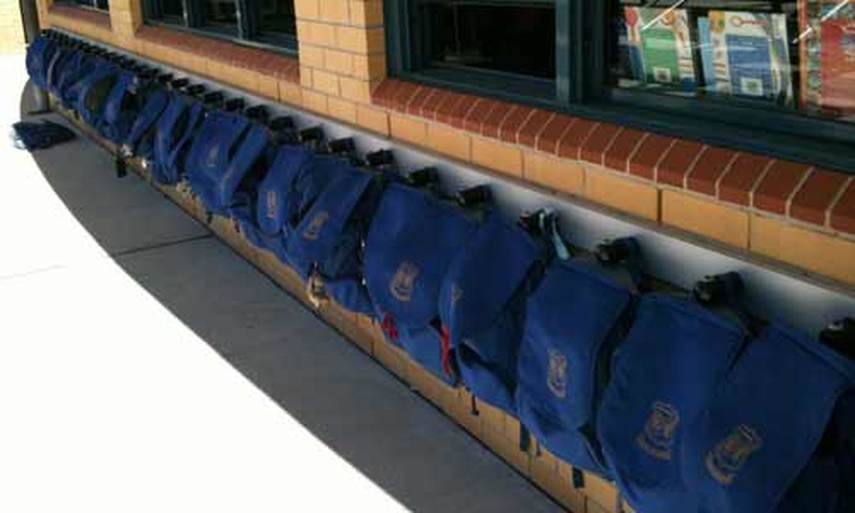
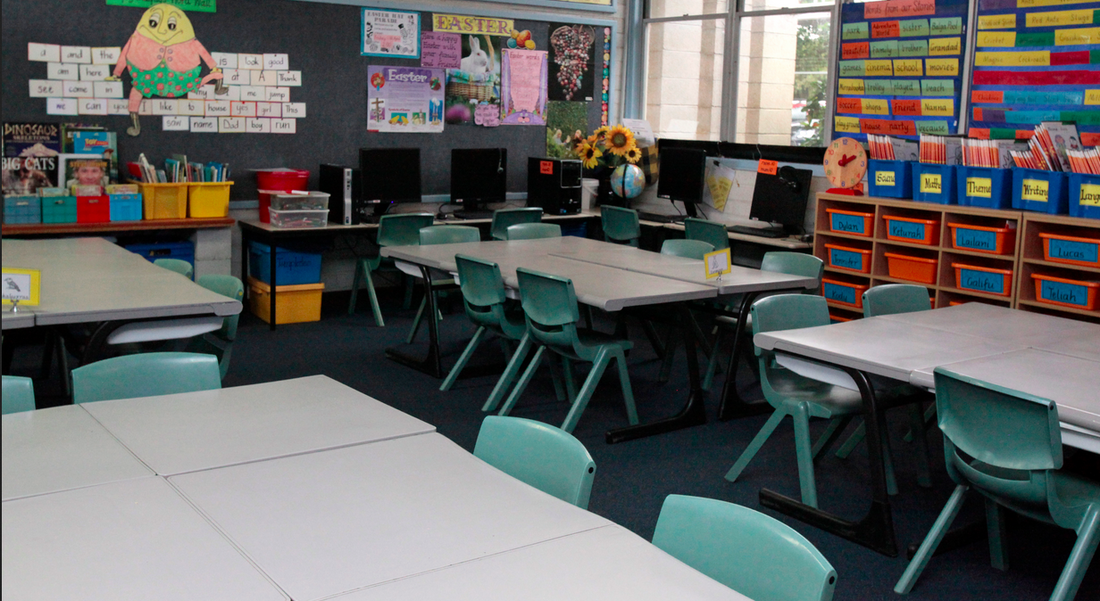
Create a table to record the frequency of a number of items in a mystery classroom. We will then go into that classroom to collect and record your findings.
Stretching the Brain:
How many people are in the room today?
Explain how you know with at least 3 reasons.
Explain how you know with at least 3 reasons.
Strengthening the Brain:
Getting to School
Getting to School
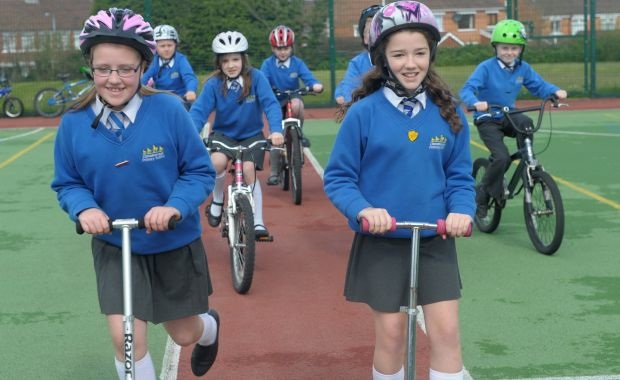
When considering how students get to school in the mornings, ask: Would we get better information by observing others or by asking how they get to school?
When considering how students get to school in the mornings, ask: Would we get better information by observing others or by asking how they get to school?

|

|
|

|
Firing up the Brain:
Preparing the Brain:
WALT: Collect our own data and display it accurately using a table and a graph.
WILF: You can collect, display and interpret data.
WILF: You can collect, display and interpret data.
Engaging the Brain:
Getting to School
How do students get to school in the mornings?
Would we get better information by observing others or by asking how they get to school?
How do students get to school in the mornings?
Would we get better information by observing others or by asking how they get to school?
Stretching the Brain:
1. Create a plan of how you are going to collect your information.
2. Create a plan of who you are going to ask.
3. Collect and record your data.
4. Interpret and explain your data.
5. Justify how you know your data is accurate.
2. Create a plan of who you are going to ask.
3. Collect and record your data.
4. Interpret and explain your data.
5. Justify how you know your data is accurate.
